Tiny Code Studio
Tiny Boards Development
(with integrated software debugger)
Tiny Code Studio allows you to create, send and debug (with no hardware debugger) programs for Arduino Boards. It can manage your project(s) files, check in real time that there's no error in your code, colorize the keywords and autocomplete the variables/functions names.
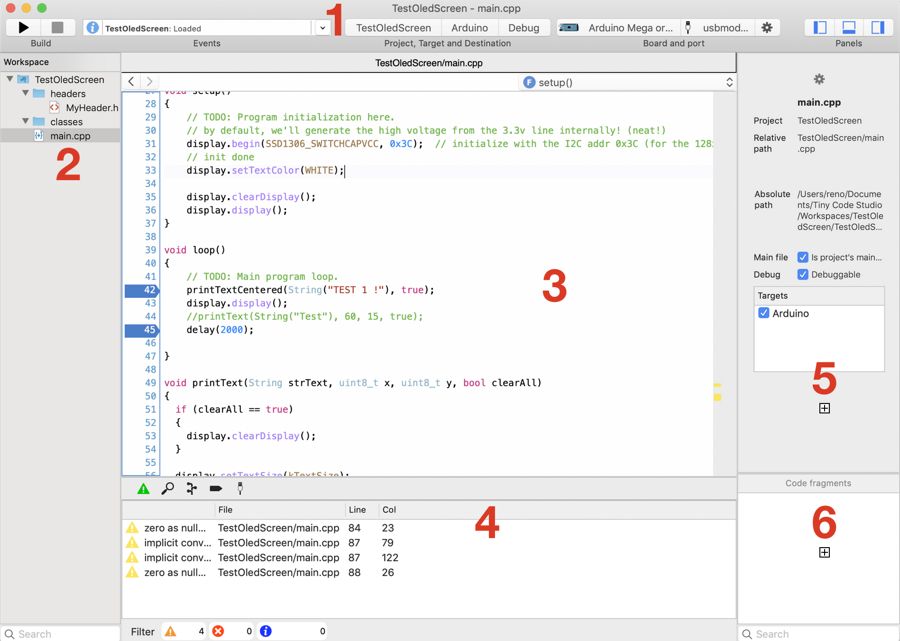
Top Bar : used to compile, choose the project/target/destination to compile, the board type and the USB Port to send the data to. Allows you to show/hide the explorer, property and bottom panels too.
Files Explorer : manages the files in the workspace. It’s possible to move, rename, remove and add a file or a project by right clicking on any file.
Code Editor: used to edit a file (.h, .hpp, .c or .cpp).
Bottom panel : used to displays errors and warnings, do a search, display all references of a variable or function, show all breakpoints or display the debugger.
File properties: shows the file's path, if it's the project main file, if it's debuggable and the selected target(s) for this file.
Code fragments [Betat note: not implemented yet !].

Build/Stop : Compile and flash the board or stop the current compiling/connection. (Note: disabled if no board and no USB port are selected).
Events : list of events and compiling errors. When clicked, details appear and it becomes possible to copy the entries content in the clipboard. Displays the progress bar when compiling too.
Project, target and destination : Project, target and destination selected for compiling.
A target can be seen like a "type" of project [Beta note: for now there's only "Arduino", but in the future there will be other boards + others target types like "Arduino Library" or "Arduino Unit Test"].
A destination is a type of compiling [Beta note: for now it's only "Debug" or "Release". But it will be possible in the future to add custom destinations where parameters ("-D") sent to the compiler will be different].
Board and Port: Board and USB port selected for compiling. The configuration button to the right (gear icon) can be used to set the serial port speed when flashing the board and debugging (some USB chipsets like the CH341 may require a slower bauds rate). It can also be used to choose the correct MCU for boards with variants (e.g. the Arduino Mega).
Panels : shows or hides the lateral/bottom panels.
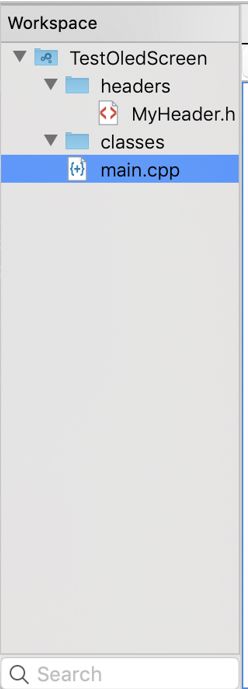
The workspace can contain one or multiple projects, folders and files. The folders and files match a physical file on the hard drive, but they must be linked to the project to be visible in the Files Explorer.
Select a file to show its content in the Code Editor. Move one or multiple files in the Files Explorer to move them physically on the HDD.
A right click on any element shows a context menu:
- Create New File : shows a dialog to create files based on predefined templates.
- Add Existing File… : shows a dialog to add an existing file on your HDD to the project. Note that if the file isn’t physically in the project’s subfolder, it will be copied inside it.
- Add New Project To Workspace : create a new project in the workspace. Having multiple projects in the same workspace allows you to group projects with a same purpose. By example, project X could be a ‘server’ program on an Arduino Mega while project Y could be its 'client' on an Arduino Uno.
- Delete : remove a file or folder. You can choose to definitely remove the file from your HDD or just unlink it from the workspace.
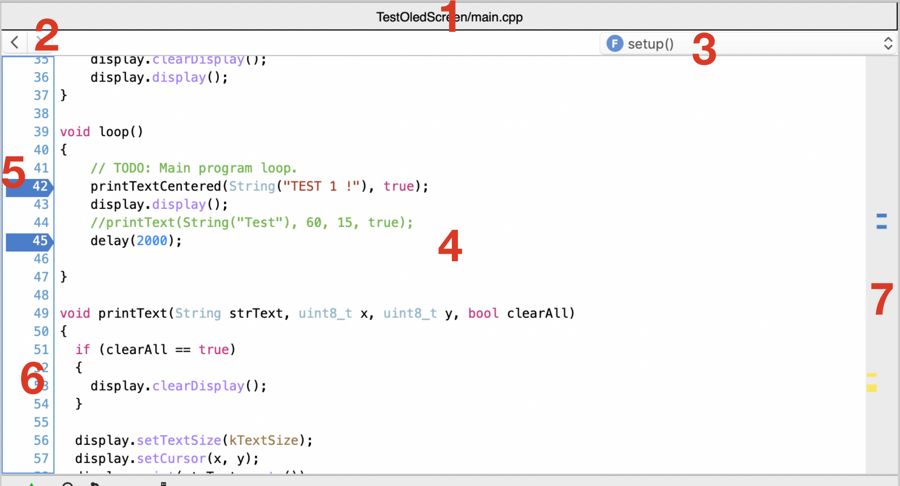
Tab bar: you can open a new tab by right clicking on a file in the Explorer and choosing "Open in a New Tab". It is possible to have the same file opened in multiple tabs.
History buttons : make the cursor go to the previous or next position it was before, in the same file or not.
Functions list: gives fast access to functions, methods and bookmarks ("// TODO:" or "// MARK:"). Note: if you type // MARK: - Something in the code editor, a new bookmark (Something) preceded by a line separator will appear in the list, .
Edit zone: you write the code of your program here.
Breakpoint: used to pause the program execution when compiled in Debug destination. Create a breakpoint by clicking on a line number. If the program goes to this line, it will be stopped. Note that a breakpoint outside of the program (e.g. outside of a function or outside of a method) will never be reached.
Line numbers.
Lint: shows errors, warnings and breakpoints with coloured rectangles. The height of the lint represents the total height of the code file.
1. Diagnostics List
This panel displays your code's diagnostics (notices, warnings and errors). Note that you can still compile your code if there are notices or warnings, but not if there are errors.
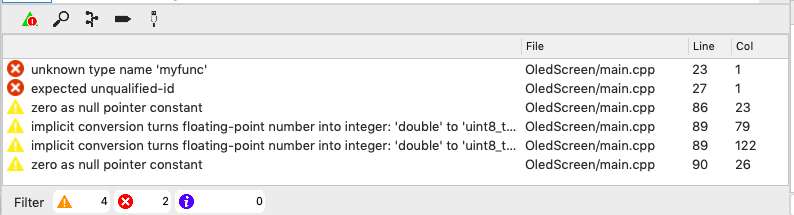
The list shows the description, the file and the position where it's occuring (line and column). You can double-click on the list element to automatically go to the corresponding file and position.
At the bottom you can filter the diagnostics by types: mask all diagnostics of the type you want by clicking on its button. Show them again by clicking on it a second time.
2. Search
This panel allows you to search for a specific term and displays the results.
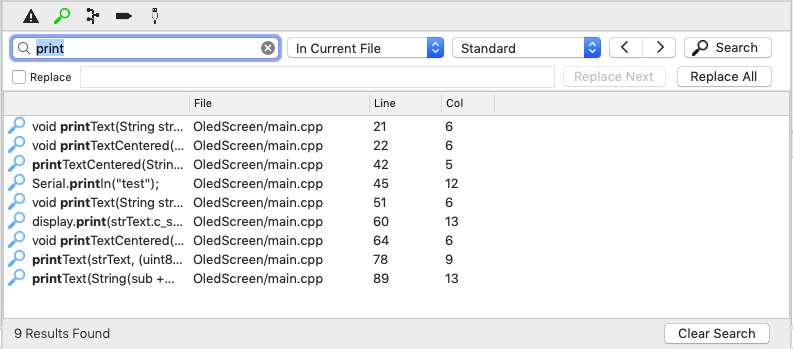
Enter the words you want to search, the scope of the search (whole workspace, current project, current file or selected text) and what type of search you want: standard, with regular expression or with extended characters (like \t for tabulations or \n for new lines).
Click the Search button to launch the search: you can then navigate between results with the arrow buttons (< and >).
You can choose to replace the results by another value by checking the "Replace" checkbox.
When using the regular expression search, you can use $1, $2, $3, ... in the Replace field to substitute the groups found in the expression (by example: with the regex 'foo(\d+)x' replaced by 'bar$1x', the text 'foo432x' will be replaced by 'bar432x').
Double-click on a list's element to automatically go there.
3. References List
Shows all references found for a variable or function.
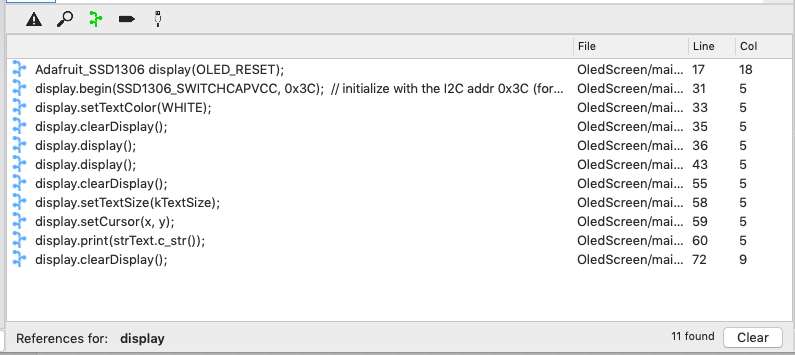
To show this panel, right-click on a word in the text editor and choose "Show References". It displays a list containing all references found for this word in the project.
Double-click on a list's element to automatically go there.
4. Breakpoints List
This panel lists the breakpoints.
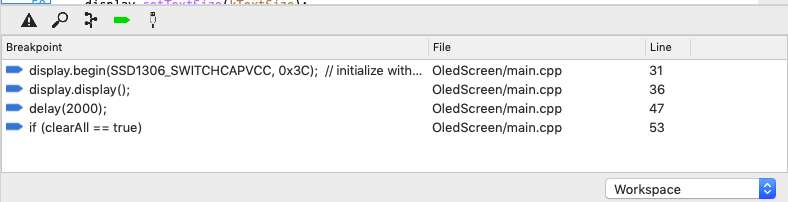
You can filter the list to show all breakpoints in the workspace, in the current project or in the current file.
Double-click on a list's element to automatically go there.
5. Serial connection (+ Debugger)
This panel allows you to initiate the communication between your computer and a board. When debugging, it shows you the variables state, the memory usage, the text output (informations + Serial.print() messages) and gives you control to pause the program or go to the next breakpoint (note: some panels are disabled in Release destination).
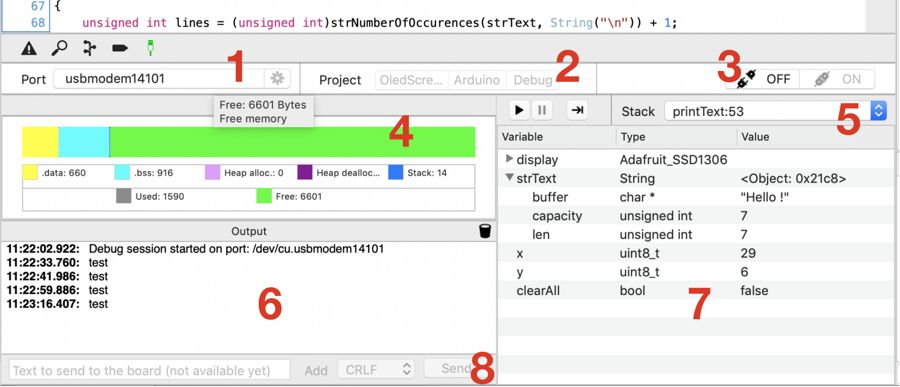
Port selected for the serial connection.
Project, target and destination. If there's currently a connection on the selected port, this control will be disabled.
ON/OFF: disconnect or launch the connection on the selected port without compiling first. It's handy to launch a connection without having to re-compile the program. If the destination is Debug, please be sure that the program inside the board is the last version compiled with this destination.
Memory usage: shows the total memory usage and free space. Gives the details of each memory types (heap, stack, .bss, …).
Callstack: shows you the line where the program has stopped and lists the previous functions calls. Select a previous element to go there and show its variables values.
Output text: general informations + text sent from the program with Serial.print() [Beta note: Serial.write() doesn't work yet. For now please don't use it as it could disrupt the debugger communication and invalidate all subsequent messages !].
Variables state: shows the current variables values (local and global) [Beta note: all types are not implemented yet (by example: arrays will display an error). Plus: for now the variables values are visible in this panel only, but in the future they will appear too as a tooltip when the mouse cursor is over a variable].
Send data to serial: allows you to send data to the Arduino board via the serial port [Beta note: it's disabled for now in Debug destination. This one is a little tricky, I'm working on it].
Shows the selected file's path, if it's the main file, if it's debuggable and its target(s).
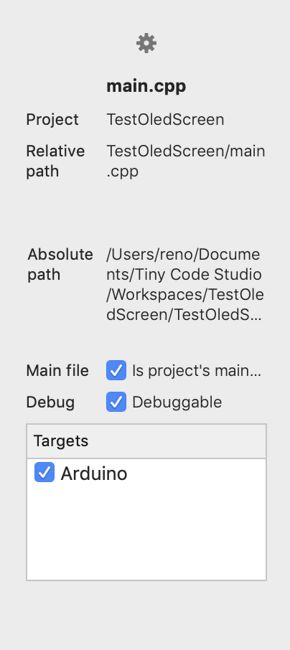
- Project: name of the file's project.
- Relative Path : relative path of the file in the workspace.
- Absolute path : physical path of the file.
- Main file : checked if the file is the project's main file. Note : each project must have a main file !
- Debug: set a file to be debuggable or not. A debuggable file allows you to use breakpoints to pause the program execution and show the memory usage. Note that compiling in Debug destination takes more flash space than in release destination, so each program used in production should always be compiled in Release destination !
- Targets: when checked, the file will be used when compiling the project. Otherwise it will not be considered [Beta note: should always be checked for now since there's only one type of target. When there will multiple targets types ("Arduino Library", "Unit tests", "custom",…) then it will really be useful to be able to select a file or not].
To compile a project, you have to select this project in the top bar, select its target (Arduino) and its destination (Debug or Release). You must choose a board too and a USB port otherwise the "Play" button will not be enabled.
Click the "Play" button to start compiling. There are a few steps:
When the flashing is done, the program resides inside your board and it starts immediately.
The Debug destination allows Tiny Code Studio to alter your program before sending it to the board. The program can then be paused whenever you want to check the variables state or see the memory (RAM) usage. There's no need to use a hardware debugger (and no annoying setup to make): all debugging messages transit by the USB port of your computer.
However, compiling in Debug destination uses more space in the board's flash memory (where the compiled program resides). Flash memory is very limited (32 kB to 256kB), so you may have to choose your board model (Uno, Mega, …) in consequence. Finally note that as the connection requires a lot of messages between the board and the computer, the program execution may be slower in Debug than in Release destination (especially when there's loop or while instructions with a lot of iterations). In fact, a program already debugged and ready to be used in production should always be compiled in Release and not in Debug destination !
Warning: debugging uses the Serial1 port (pins D0 and D1 of the board) so they cannot be used for anything else ! [Beta note: in the future there will be a "bridge" mode where another Arduino Board will be able to forward messages to the computer, which will free D0 and D1].
The Release destination contains no debugging information and the compiling optimisations regarding the final size of the program are a lot better than in Debug destination.
However it's impossible to pause the program or display the memory usage. A program used in production should always be compiled in Release destination.
Here are some problems you may encounter while using Tiny Code Studio and their resolution. For more, please check the F.A.Q and the bugs list.
Problem: I get a "linking [terminated with error]: undefined reference to `[function name]'" error when compiling:
Solution: Check that all files needed for compiling (i.e. having methods or functions used in the program) have their target checked in the file properties panel (to the right). If not checked, theses files are not considered at all for building which leads to this error.
Problem: The program never stops on the breakpoint I placed.
Solution:
There can be multiple reasons for this. Check the following:
Problem: The "play" button used to compile is always disabled:
Solution: This button stays disabled until you provide a target, destination, board and USB port. Be sure to set all of them in the Top Bar and it should become enabled.
Problem: Nothing happens when clicking the "Play" button:
Solution: Check that there is a Main File for this project ("Main File" checkbox checked in the File Properties panel). Alternatively, check for a message in the output text area in the debugger (bottom bar). [Beta note: a message here will be more visible in the future]